Machine Learning
21 November 2022
Train Balloon Segmentation Model on VESSL
Getting started with MLOps with git-committed code, versioned datasets, and experiment tracking
What we’ll build
In this post, you will learn how to train an image segmentation model with Detectron 2↗ on VESSL. With VESSL experiment, you can bring the training code from GitHub↗, mount the dataset↗, run a machine learning training↗, and manage the artifacts↗. Let’s build a balloon segmentation model by fine-tuning the pre-trained model on the balloon dataset↗.
Write training code
You can use the example code on VESSL’s GitHub repository (vessl-ai/examples↗).
First of all, let’s write some training code. The training code↗ has partially been modified from the Detectron2 official Colab guide↗. I won’t go through all codes in detail, but I would like to point out a few lines of code written to use the key features of VESSL experiment.
Set input and output paths
When a dataset is mounted to the VESSL experiment in runtime, the dataset is attached to a specific path, /input , in the experiment container by default. Also, the default output path is set to /output. If you save the checkpoints and the models in the default output path, you can easily download the files or create a model↗ with those files after the experiment is completed.
- Default input path on VESSL:
/input - Default output path on VESSL:
/output
I’ll show you how to create a dataset in VESSL in a moment, but first, set the path as follows in all parts of the code that read the dataset. The function get_balloon_dicts() takes the path /input/baloon as the parameter and loads the dataset from there.
def get_balloon_dicts(img_dir):
  json_file = os.path.join(img_dir, "via_region_data.json")
  with open(json_file) as f:
    imgs_anns = json.load(f)
  ...
  return dataset_dicts


for d in ["train", "val"]:
  DatasetCatalog.register("/input/balloon_" + d, lambda d=d: get_balloon_dicts("/input/balloon/" + d))
  MetadataCatalog.get("/input/balloon_" + d).set(thing_classes=["balloon"])
Set the training dataset path and output directory configuration as follows. For more information about the detectron2 configuration, please refer to the detectron2 documentation↗.
config = get_cfg()
...
config.DATASETS.TRAIN = ("/input/balloon_train",)
...
config.OUTPUT_DIR = "/output"
...
Moreover, set the input and output directory of the evaluator as follows.
evaluator = COCOEvaluator(
    "/input/balloon_val", cfg, False, output_dir="/output/")
Logging metrics and images on VESSL
As you can see in the screenshots below, you can record various types of data in VESSL↗. Let’s log metrics and images with the simple command vessl.log().


Logged metrics and images during model training
In this example, I will wrap the vessl.log() with the hook that inherits HookBase provided by detectron2, and register the hook with a register_hooks() method in the trainer later.
import vessl
from detectron2.engine import DefaultTrainier, HookBase
class VesslHook(HookBase):
def after_step(self):
logging_metrics = [
'loss_cls', 'loss_mask', 'total_loss',
'fast_rcnn/cls_accuracy', 'fast_rcnn/false_negative', 'fast_rcnn/fg_cls_accuracy',
'mask_rcnn/accuracy', 'mask_rcnn/false_positive', 'mask_rcnn/false_negative',
]
for metric in logging_metrics:
vessl.log(
step=self.trainer.iter,
payload={
metric: self.trainer.storage.history(metric).latest(),
}
)
...
trainer = DefaultTrainier(cfg)
after_step_hook = VesslHook()
trainer.resgister_hoooks([after_step_hook])
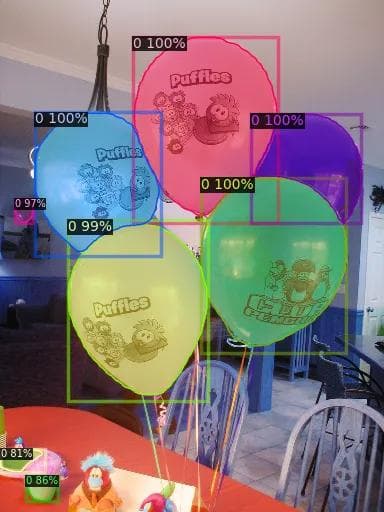
trainer.train()I will record the images of inference results on the trained model. Among those resulting images, nine randomly selected inference images are recorded on VESSL by using vessl.log() and vessl.Image() as the following code snippet. For more detailed instructions on VESSL SDK, please refer to the VESSL documentation↗.
import cv2
import random
import vessl

from detectron2.engine import DefaultPredictor

predictor = DefaultPredictor(cfg)
dataset_dicts = get_balloon_dicts("/input/balloon/val")
for d in random.sample(dataset_dicts, 9):
  im = cv2.imread(d["file_name"])
  outputs = predictor(im)
  v = Visualizer(
    im[:, :, ::-1],
    metadata=balloon_metadata,
    scale=0.5,
    instance_mode=ColorMode.IMAGE_BW
  )

 out = v.draw_instance_predictions(outputs["instances"].to("cpu"))
 image = out.get_image()[:, :, ::-1]
 vessl.log(
   payload={"inference-image": [
     vessl.Image(data=image, caption=d["file_name"])
   ]}
 )
Once you have completed the training code, push it to your GitHub repository, then you’re good to go.
Integrate GitHub repository
VESSL recommends using code versioning tools such as GitHub and BitBucket. First, integrate your GitHub account into the VESSL organization, and create a project that connects to a specific GitHub repository from the account.
Integrate GitHub to VESSL Organization
Go to the Organization settings > Integrations page, and connect GitHub or BitBucket repositories to VESSL↗.

The vessl-example-repository at GitHub is integrated to VESSL
Create a project with an integrated GitHub repository
Next, go to Projects > New project page and create a project↗ with the integrated GitHub repository.

Create a project with vessl-ai/examples repository from GitHub
Create a dataset
VESSL dataset↗ can be created from various sources. In this example, I will create a dataset by importing data from the AWS S3 public bucket that I have created in advance.
Create a dataset from AWS S3
Go to Datasets > New Dataset > Amazon Simple Storage Service, and create a new dataset using the public S3 bucket path as shown below.
Bucket path: s3://vessl-public-apne2/detectron2/
Create a VESSL dataset from a public S3 bucket
Register the dataset to the project
Now, register the created dataset on the Projects > Settings page. Once you have registered the repository and dataset to the project↗, they will serve as a template to create an experiment that helps you to configure the volume mount configuration more easily.


The registered project repository and dataset will appear in the volume mount configuration on the experiment create page
Run an experiment
Deploy experiment
Now we are ready to run the experiment↗. Let’s create an experiment by selecting the suitable GPU resource, selecting a Docker image, and entering the start command to run the training code.


Explore experiment dashboard
The dashboard is provided in two views: table and chart view. A table view shows the experiment status, tags, and the summary of hyperparameters and metrics. As you can see, the table is a suitable way to see the experiment configuration at a glance.

On the other hand, the chart view shows the common metrics of the experiments combined into one plot. It makes it easier to analyze the numerical comparison of experiments in different settings.

Conclusion
A high-performance machine learning model cannot be built with just one experiment run. Therefore, although it may look somewhat complicated, VESSL suggests that you should manage your machine learning project in the same way as above; versioning code and dataset, and recording configuration and results. Besides, there are still many interesting features in VESSL. We will cover them one by one in the next post.

Intae Ryoo
Product Manager
Try VESSL today
Build, train, and deploy models faster at scale with fully managed infrastructure, tools, and workflows.